All Posts
Microsoft Azure's notebooks
26 May 2017Recently Mike Croucher blogged about Microsoft Azure’s free Jupyter notebooks. He showed that the computational power provided by Microsoft Azure Notebooks is quite considerable. This is a free cloud service, and Jupyter notebooks power the interface. We can use within those notebooks both Python (2.7 and 3.5.1), F#, and R (3.3), and we have the ability to install packages if needed. 1
Although there is a 4Gb memory limit, the notebook has access to fast processors, eight in fact.2 I was curious to see if the service allowed parallel computing, and to my surprise it does. The machine uses Linux, but I was not able to fork the processes. However, it was possible to create a PSOCK cluster and use it. Since this is a PSOCK cluster, nodes do not share the same environment which adds some setup costs to the parallelization, particularly if large objects must be passed to them.
dplyr 0.5 - new functions: part - II
29 April 2017In the previous post I have described the first five functions, introduced by dplyr 0.5, that are listed below:
- coalesce()
- case_when()
- if_else()
- na_if()
- near()
- recode()
- union_all()
- summarise_all() and mutate_all()
- summarise_at() and mutate_at()
- summarise_if() and mutate_if()
- select_if()
In this post, I’ll describe the others. Meanwhile, the next version of dplyr is just around the corner, and will also bring new features.
recode()
The recode() function, as the name states, allow the recoding of a vector of values. There is also a similar function for factors: recode_factor().
Let’s take the following data_frame:
library(dplyr)
d_f <- data_frame(x = c(1:5, NA), y = letters[1:6])
d_f
## # A tibble: 6 × 2
##       x     y
##   <int> <chr>
## 1     1     a
## 2     2     b
## 3     3     c
## 4     4     d
## 5     5     e
## 6    NA     f
We can use recode to change numeric or alphanumeric values, but replacements must be all of the same type:
dplyr 0.5 - new functions: part - I
11 March 2017dplyr version 0.5 introduced several new functions:
- coalesce()
- case_when()
- if_else()
- na_if()
- near()
- recode()
- union_all()
- summarise_all(), mutate_all()
- summarise_at() and mutate_at()
- summarise_if() and mutate_if()
- select_if()
Let’s take a look at the first five.
coalesce()
library(dplyr)
The coalesce() function takes two or more vectors as arguments and finds the first non-missing value at each position. It serves a similar purpose as the COALESCE SQL function.
It is easy to illustrate what the function does with a simple example:
y <- c(NA, 2, NA, NA, 5)
z <- c(NA, NA, 3, 4, NA)
w <- c(10, 20, 30, NA, NA)
coalesce(y, z, w)
## [1] 10 2 3 4 5
All vectors must be of the same type, if you try to mix different types it will result in an error:
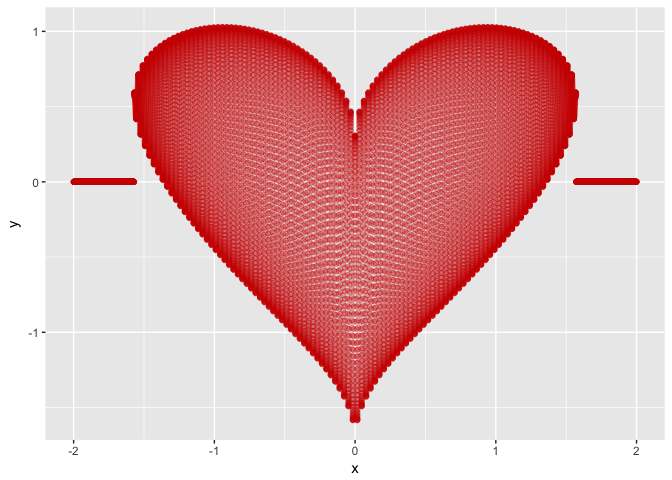
R's valentine
14 February 2017There are several ways of plotting a heart shaped function. The following is a simple one using ggplot2:
library(ggplot2)

heart <- function(x) {
  h <- suppressWarnings(sqrt(cos(x))*cos(200*x) + sqrt(abs(x))
                        - 0.7*(4 - x^2)^0.01)
  h[which(is.nan(h))] <- 0
  return(h)
}

ggplot(aes(x), data = data.frame(x = c(-2,2))) +
  stat_function(fun = heart, color="red3",
                geom = "point", n = 15000, alpha=0.3)
R's tidyverse
20 January 2017Hadley Wickham’s universe of packages along with pipes (%>%) from the magrittr package has transformed the way I use R. They create a new dialect for R and provide a large set of tools for data manipulation and visualisation.
They were formerly and informally known as Hadleyverse, but the author prefers the term tidyverse. This set of packages can now be installed and loaded using a wrapper package called tidyverse.
One way to learn more about tidyverse is to watch one, or all, of the several talks given by Hadley:
- Hadley Wickham: Managing many models with R - YouTube
- Making Data Analysis Easier - YouTube
- Pipelines for Data Analysis - YouTube
- Stanford Seminar - Expressing yourself in R - YouTube
- Stanford Seminar - Expressing yourself in R - YouTube
- Hadley Wickham’s “dplyr” tutorial at useR 2014 (1/2) - YouTube
- Hadley Wickham’s “dplyr” tutorial at useR 2014 (2/2) - YouTube
Or, even better, read his latest book: R for Data Science. The book is also available for free here.