R's valentine
2017-02-14
R
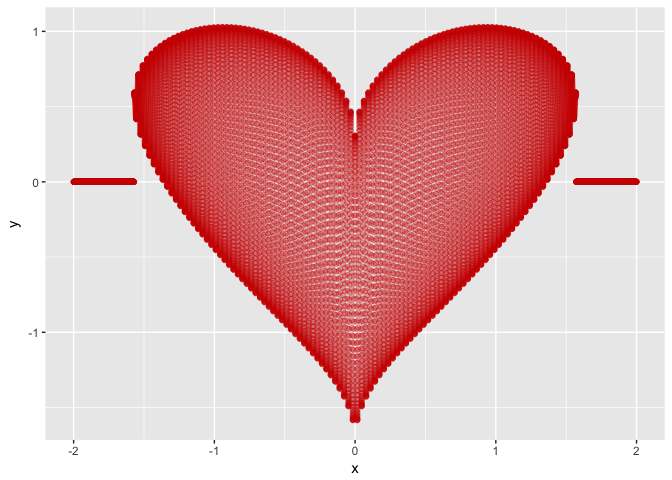
There are several ways of plotting a heart shaped function. The following is a simple one using ggplot2:
library(ggplot2)

heart <- function(x) {
  h <- suppressWarnings(sqrt(cos(x))*cos(200*x) + sqrt(abs(x))
                        - 0.7*(4 - x^2)^0.01)
  h[which(is.nan(h))] <- 0
  return(h)
}

ggplot(aes(x), data = data.frame(x = c(-2,2))) +
  stat_function(fun = heart, color="red3",
                geom = "point", n = 15000, alpha=0.3)